
Have you ever tried to explain to a client how much a software project will cost and heard: “But why does it take so long?” or “Why does it cost so much?”. The difficulty lies in translating functionality into size, and size into effort. For decades, the software industry tried to solve this problem by counting lines of code, but that’s like measuring an apartment by the number of bricks: technically possible, but completely useless for someone who needs to understand what they’re buying.
Imagine you’re looking for an apartment. The realtor doesn’t show you how many bricks went into the construction or how many bags of cement were used on the job. They tell you: 80 square meters, 3 bedrooms, 2 bathrooms, living room open to the kitchen. You immediately understand the size and functionality of the space. That’s exactly the idea behind Function Points: a universal measure that expresses the size of software from the perspective of the people who will use it, regardless of the technology used to build it.
This article demystifies Function Point Analysis (FPA), an international metric created almost 50 years ago that is still one of the most reliable ways to measure software. Let’s understand what function points are, how they work in practice, why they’re technology-independent and how they can transform the way you estimate and manage projects.
The Problem with Measuring Software
Imagine trying to compare two apartments where one was built with clay bricks and the other with concrete blocks. If you measure by the amount of material, you’ll get completely different numbers, even if the apartments have exactly the same size and functionality. The same thing happens when we measure software by lines of code: a system in Python might have 1,000 lines, the same system in Java might have 3,000 lines, but both deliver the same functionality to the user.
That’s why the software industry needed a universal measure, something that focused on the “what” and not the “how”. Without a standard, estimates become subjective, comparing productivity across teams is impossible and contract negotiation turns into a guessing game.
What Are Function Points?
Function Points are like square meters in construction. It doesn’t matter whether the house was made of wood, brick or concrete. It doesn’t matter whether the finish is luxurious or simple. Square meters measure the functional space available. In the same way, Function Points measure the functionality available to the user, regardless of whether it’s built in Java, Python, .NET or any other technology.
Created by Allan Albrecht at IBM in 1977, Function Point Analysis is now an ISO/IEC standard. Its fundamental principle is to measure software from the user’s point of view, quantifying the functional requirements the system delivers.
The Five Rooms of Software: Counting Components
When an architect measures an apartment, they don’t just count the total square meters. They identify the rooms: how many bedrooms, how many bathrooms, whether there’s a balcony. Each type of room has a value. In the same way, in Function Point counting, we identify the software’s “functional rooms”, which fall into two types: Data Functions and Transaction Functions.
Data Functions (Where we keep things):
- Internal Logical Files (ILF): Think of them as the built-in closets inside your apartment. They’re groups of data maintained by the application itself (e.g., a customer table, a product table).
- External Interface Files (EIF): They’re like the shared storage lockers in the building hallway. They’re data your application reads but that is maintained by another system (e.g., a ZIP code table maintained by a Brazilian Postal Service system).
Transaction Functions (What we do in the rooms):
- External Inputs (EI): This is the front door of your apartment. It’s any process that lets the user put information into the system, changing the state of an internal closet (e.g., a customer registration form).
- External Outputs (EO): This is a window with an elaborate view. It presents the user with information that has been processed, calculated or derived (e.g., a monthly sales report with totals and averages).
- External Inquiries (EQ): This is like a mirror. It just reflects information that already exists, without any complex processing. It’s a simple lookup that presents data from an internal or external closet (e.g., a screen that searches for and displays a specific customer’s data).
Complexity: A Simple Apartment or a Duplex Penthouse?
Two apartments can both be 80 square meters, but one might be a simple studio (low complexity) and the other a loft with a mezzanine and a gourmet kitchen (high complexity). In Function Points, we measure that complexity by analyzing how many “elements” each function handles and how many “files” it accesses.
Each of the five components (ILF, EIF, EI, EO, EQ) is classified as Low, Average or High complexity, and each combination has a weight in function points, as shown in the table below:
Table 1: Function Point Contribution by Complexity
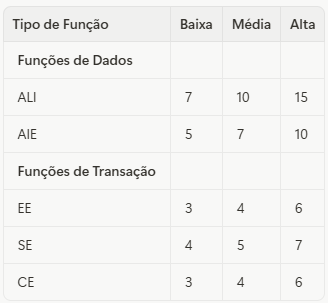
_Function Point Contribution by Complexity_
But how do you know whether it’s Low, Average or High? This is where the classification rules come in:
For Data Functions (ILF and EIF):
Complexity depends on two factors:
- DET (Data Element Types): Each unique field recognized by the user. For example, in a Customers table: Name, CPF (Brazilian taxpayer ID), Email, Phone = 4 DETs.
- RET (Record Element Types): Subgroups of data within a file. In most simple cases, it’s 1. It increases when there are subtypes or optional relationships.
Table 2: Complexity Matrix for ILF and EIF
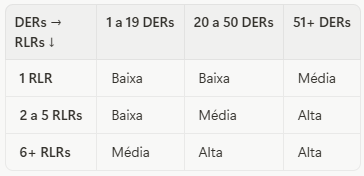
_Complexity Matrix for ILF and EIF_
For Transaction Functions (EI, EO, EQ):
Complexity depends on:
- DET (Data Element Types): Fields the user can enter or view in the transaction.
- FTR (File Types Referenced): How many ILFs or EIFs the transaction reads or updates.
Table 3: Complexity Matrix for EI
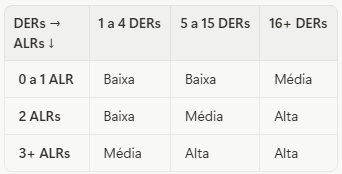
_Complexity Matrix for EI_
Table 4: Complexity Matrix for EO and EQ
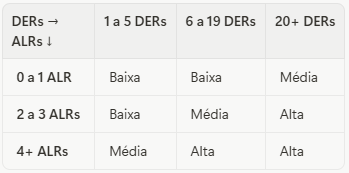
_Complexity Matrix for EO and EQ_
A Practical Example: Measuring a Registration System
Let’s measure the “floor plan” of a customer registration system. It has one “closet” (the customer table), one “front door” (the registration form), one “window with an elaborate view” (the customer report) and one “mirror” (the customer lookup).
1. Identify Functions:
- Customer Table: 1 ILF
- Registration Form: 1 EI
- Customer Report: 1 EO
- Customer Lookup by CPF: 1 EQ
2. Determine Complexity:
ILF - Customer Table:
- Fields: Name, CPF, Email, Phone, Address, City, State = 7 DETs
- Subgroups: 1 RET (just the main table)
- Looking up Table 2: 7 DETs + 1 RET = Low (7 FP)
EI - Registration Form:
- Fields entered: Name, CPF, Email, Phone, Address, City, State = 7 DETs (but since there are fewer than 15, we count them as is)
- Files accessed: 1 FTR (writes to the Customers table)
- Looking up Table 3: 7 DETs (between 5-15) + 1 FTR = Low (3 FP)
EO - Customer Report:
- Fields displayed: Name, CPF, Email, City + Total Customers = 5 DETs
- Files read: 1 FTR (reads the Customers table)
- Looking up Table 4: 5 DETs (between 1-5) + 1 FTR = Low (4 FP)
EQ - Lookup by CPF:
- Fields displayed: Name, CPF, Email, Phone, Address = 5 DETs
- Files read: 1 FTR (reads the Customers table)
- Looking up Table 4: 5 DETs (between 1-5) + 1 FTR = Low (3 FP)
3. Add Up the Total:
- Total Size = 7 + 3 + 4 + 3 = 17 Function Points
Done! Our “digital apartment” has a size of 17 Function Points. Now you understand not just the result, but how we got there.
What Is Knowing the Size Good For?
When you know an apartment is 80m², you can estimate how much the flooring will cost, how long it takes to paint and how much furniture will fit. In the same way, knowing that a system has 200 function points and that your team delivers, on average, 5 FP per week, you can estimate that the project will take 40 weeks. FPA lets you:
- Estimate schedule and cost based on historical data.
- Measure and compare productivity across teams (FP/hour).
- Create contracts based on price per function point.
- Benchmark across projects and vendors.
Function Points in Analytics and Data Warehouse Projects
And what about when the “apartment” isn’t a traditional system, but a Data Warehouse or an analytics project? The good news is that the principles still hold, but they need some adaptation. The Brazilian government published a specific guide for counting Function Points in Data Warehouse projects, recognizing that the multidimensional model (Fact and Dimension tables) has its own characteristics.
In a DW project, each Fact table and each Dimension table is counted as an ILF. The ETL (Extract, Transform, Load) process is counted as an External Input (EI), since it brings data in from outside and feeds the internal closets. Reports and dashboards, in turn, are counted as External Outputs (EO) when they involve calculations and aggregations, or External Inquiries (EQ) when they just present data without complex processing.
The challenge here is that the development effort for ETL is usually significantly greater than for building reports, yet both can have similar FP counts. That’s why many DW contracts separate ETL and OLAP batches, recognizing that the technical complexity is different, even if the functional size is similar.
What About AI Agents? How Do You Measure Them?
Now comes the question of the moment: how do you apply Function Points to AI agent projects? There’s no official guide yet, but we can apply the same fundamental principles: measure from the user’s point of view, identify where data is stored and which operations the user can perform.
Data Functions in AI Agents:
- The agent’s knowledge base: If the agent has indexed documents or its own knowledge base, that’s an ILF (internal closet).
- Vector database: The stored embeddings are an ILF. Each collection of embeddings can be considered a logical file.
- External APIs queried: If the agent queries third-party APIs (weather, stock quotes, etc.), those are EIFs (external closets).
- Conversation history: If the agent keeps memory of previous interactions, that’s an ILF.
Transaction Functions in AI Agents:
- User prompt: Each type of interaction the user can make is an EI (front door).
- RAG (Retrieval-Augmented Generation) response: It’s an EO (window with an elaborate view), since it involves semantic search, processing and response generation.
- Simple lookup with no processing: If the agent just retrieves and displays information without elaborating, it’s an EQ (mirror).
- Function calling: When the agent takes an action (booking an appointment, sending an email), that’s an EI, since it changes the state of a system.
- Document ingestion: The process of chunking, generating embeddings and storing them is an EI (a load process, similar to ETL).
Example: Customer Service Agent
- 1 ILF: Knowledge base (FAQs, manuals)
- 1 ILF: Vector database with embeddings
- 1 ILF: Conversation history
- 1 EIF: Ticketing system (queried but not maintained by the agent)
- 1 EI: User asks a question
- 1 EO: Agent answers using RAG (search + processing + generation)
- 1 EI: Agent creates a ticket in the external system
Assuming low complexity to keep it simple: 7 + 7 + 7 + 5 + 3 + 4 + 3 = 36 Function Points.
Important: this is an interpretive application of FP principles. Since AI agent technology is recent, there’s no consolidated standard yet. But the exercise of thinking in terms of user-visible functionality is still valuable.
Important Limitations
Square meters don’t tell you whether the apartment has good lighting, whether the view is beautiful or whether the finishes are high quality. In the same way, Function Points don’t measure whether the code is well written, whether the architecture is elegant or whether the system performs well. It’s only a measure of functional size. It’s a powerful tool, but it’s not the only one.
Conclusion
The software industry matured when it realized it needed universal measures, just as construction has square meters and kilometers. Function Points aren’t perfect, but they’re a common language that enables honest conversations between clients and developers. When you say “this project has 500 function points”, you’re saying something concrete, comparable and technology-independent.
The next time someone asks you “how much is this system going to cost?”, you no longer need to take a shot in the dark. You can measure the floor plan, count the rooms and give a well-founded answer. And that, in itself, is already a revolution.