
With the rise of cloud data storage, working with data has become far more accessible, in terms of both time and cost. Tools such as Databricks and Microsoft Fabric have helped break down those barriers, offering innovative features such as zero-copy cloning and scalable warehouses that enable rapid prototyping.
These reductions in storage and processing costs have made design adjustments less impactful and easier to handle than in the past. That’s why many data engineers end up skipping the dimensional modeling phase and going straight to transformations, adjusting the model as needed.
However, this approach only works well at the start of a project. As data is loaded and dependencies are built around the core tables, changing the data model can become so expensive and complex that changes become unfeasible.
This situation can be compared to the movie The Lost World: just as in the film, where exploring the “lost world” brings the value of something forgotten back to light, dimensional modeling is a practice that may seem obsolete but is essential for long-term success. Rediscovering and applying its fundamentals can be the difference between a sustainable project and one full of obstacles.
Even with storage and compute costs falling steadily, the principle that 20% of effort on the initial design saves 80% of rework later still holds firm. Investing in modeling from the start is a strategy that pays off.
In short, no matter how much technology evolves, the fundamentals of dimensional modeling remain indispensable. Like the “lost world,” these principles are ready to be rediscovered and appreciated. 😊
Prerequisites
Before starting the actual work, it’s important to set some guidelines right at the beginning to make sure the project stays on the right track.
Good practices such as creating clear naming conventions for tables and columns and defining who will be responsible for deliverables are well-known strategies to reduce complexity and keep the project flowing smoothly. However, other, less obvious considerations often end up neglected.
Data modeling, by its nature, is based on patterns: most of the time, there’s no need to “reinvent the wheel.” So, both to make communication easier and to save time, it’s essential to be familiar with widely used terms and patterns.
That covers everything from the fundamentals (such as facts, dimensions and measures) to more advanced concepts (such as type II SCDs, upserts and degenerate dimensions), plus any specific conventions the team adopts along the way.
To keep the key concepts fresh in your mind, it’s worth keeping a copy of Ralph Kimball’s classic The Data Warehouse Toolkit close at hand. If you prefer, you can also check his website, which offers a handy summary of the main terms and concepts.
A single source of truth
Dimensional modeling, as we’ll see later, is a collaborative and iterative process. That means people from different areas of the organization need to work together to create a solution that not only meets business requirements but is also efficient and sustainable in the long run.
With so many people involved in the design, changes and adjustments along the way are inevitable. That’s why it’s essential to use a tool that makes this collaboration easy throughout the project lifecycle, enabling real-time work, dynamic sharing and change tracking, and avoiding outdated documents or knowledge silos.
In this article, I’ll use SqlDBM, an online modeling tool, to illustrate the process. SqlDBM is flexible enough to start with an initial, “whiteboard”-style design. Unlike traditional diagramming tools (such as Lucidchart or Visio), SqlDBM also generates well-formatted DDL code, specific to the chosen database, as the model evolves, saving rework.
With SqlDBM, the map really does become the territory. 😊
The process
In this article, we’ll explore the sales process of a retail company, walking through the main steps of dimensional modeling.
1. Choose the business process
The first step is to choose a single business process to model. It may seem simple, but this decision deserves attention. Trying to build the whole data warehouse at once is a common mistake: the ideal is to build one business process at a time.
The choice should be guided by the company’s priorities, considering relevance and urgency relative to other processes. The BI team can help with technical estimates, but business needs should be the deciding factor.
At this point, the BI team should meet with business experts and carry out an initial data survey. This helps create a high-level technical proposal, useful for setting the budget and schedule.
2. Define the grain
After selecting the business process, it’s time to define the grain, that is, the lowest level of detail at which the data will be analyzed. Once again, this is a decision driven by business goals.
For example, at an online retailer, we can track extremely specific details, such as the device ID and operating system for each order. That data may be useful for marketing, but it may not add value to overall sales monitoring.
If the company decides that sales should be analyzed “daily by product type,” that will be the minimum grain. It defines what each row of the fact table represents and should be treated as a commitment to stakeholders, since later changes may require significant rework.
Even when defining a specific granularity, always collect the source data at the most detailed level possible, following the ELT (extract, load, transform) pattern. That way, if tomorrow the analysis needs more detail, such as “hourly by product ID,” you’ll already have the data you need.
3. Identify the dimensions
With the grain defined, the next step is to identify the dimensions that will support the analysis. Some key dimensions may already have been identified while choosing the business process. Now it’s time to dig deeper.
During this step, dimensions shared across different business processes may also emerge, laying the foundation for the company’s bus matrix.
Even if the initial focus is a single process (such as retail sales), the bus matrix is a valuable tool for mapping related processes and highlighting common dimensions. This helps keep the design consistent and scalable for future expansion.
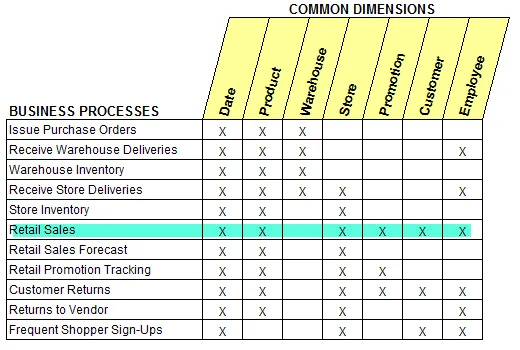
_Sample bus matrix_
A dimension is usually represented by a noun, such as store, employee or vehicle. These nouns come with attributes, such as name, description or address, which help enrich and contextualize reports.
After identifying the existing dimensions, we can start sketching a basic whiteboard. This draft will serve as the starting point for adding more detail in the next steps of the process.
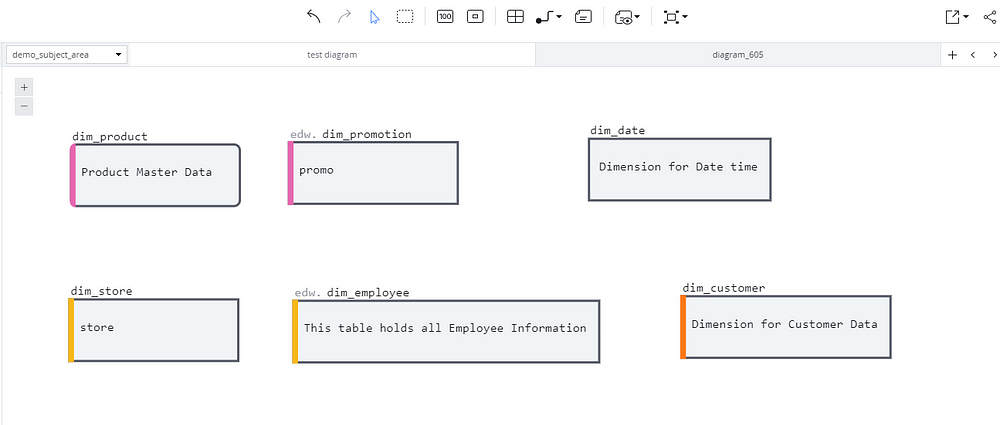
_Identifying dimensions in SqlDBM through logical modeling_
4. Identify the dimension relationships
After identifying the dimensions, the next step is to understand how they connect and interact with one another.
For example:
- Are promotions applied at the store level, the product level or both?
- Is an employee tied to a specific store, or can they work at several?
These questions guide the technical design, but the answers depend directly on the knowledge of the business experts. That’s why it’s essential to keep those experts involved throughout the modeling process, making sure functional questions are cleared up as soon as they arise.
So, are promotions applied at the product level? 🤔
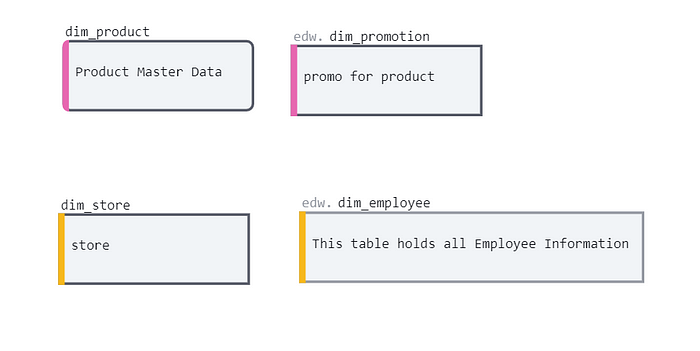
_product-level promotion_
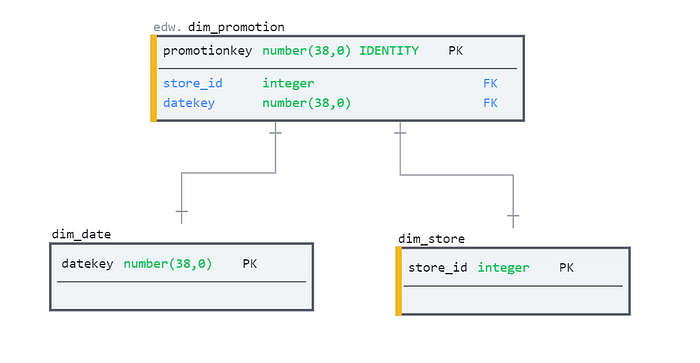
So, are promotions applied at the product level? Or do they cover the whole store? 🤔
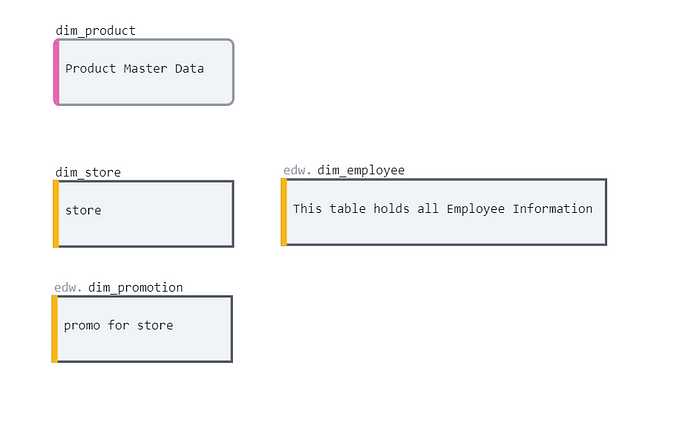
_store-level promotion_
Logical modeling offers a simplified way to visualize the design, allowing rapid prototyping before moving on to physical design. This approach makes the process more accessible, letting non-technical team members take an active part in the discussions.
In this example, we’ll go with the latter option: applying promotions at the store level. 🎯
5. Identify the facts
The next step combines the dimensions already identified (what, when) with quantitative measures (how much, how many), resulting in the model’s facts.
For example:
- Customer A bought X units of product B at a price of Y dollars, served by employee D, at store E, using promotion F, on date G.
This combination of dimensions and quantitative measures forms the fact table for the retail sales process. It will be the heart of the analysis, connecting business details to the metrics that really matter.
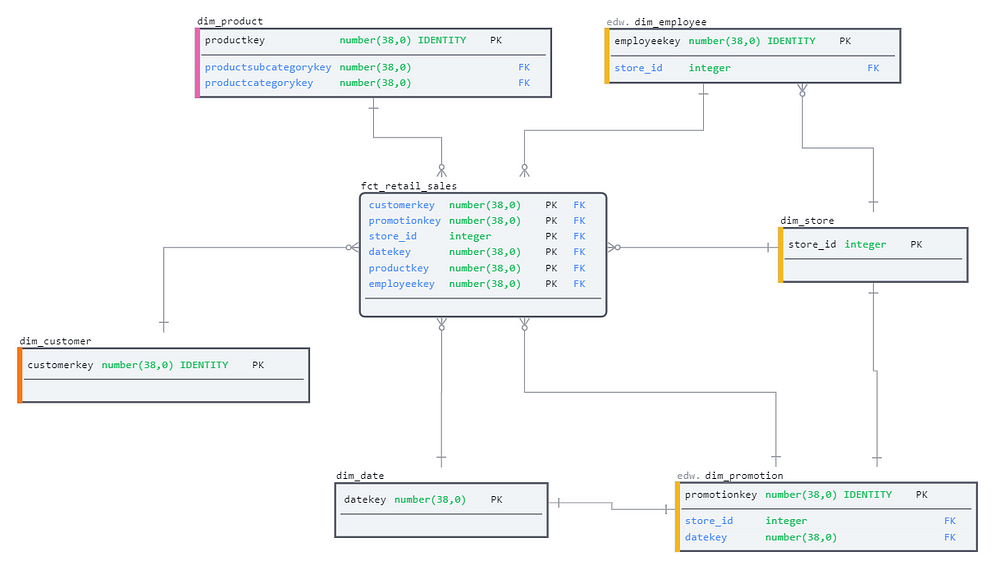
_the retail sales business process fact table with associated dimensions_
With this fact table, we can answer any business question related to retail sales using a combination of filters and aggregations.
In addition, we can expand the diagram to include important technical details, such as primary and foreign keys, making sure the model is functional and efficient.
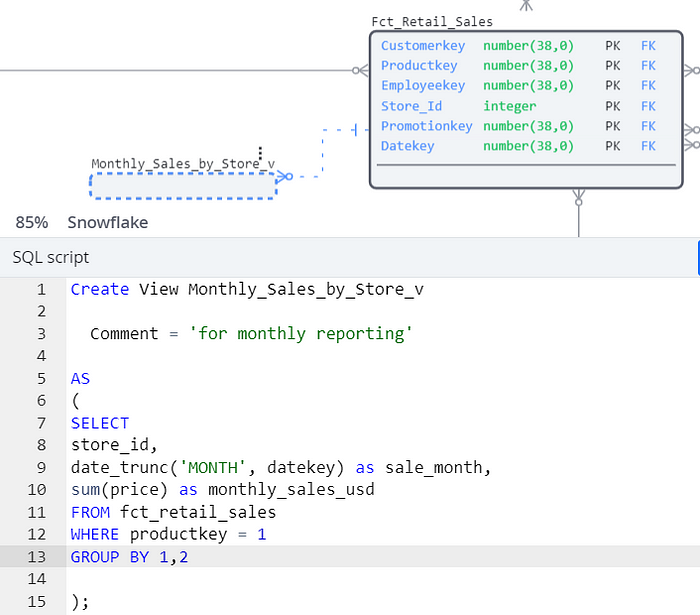
For example, if the company wants to know monthly sales by store for product B, just apply the filters and sum the relevant values in the fact table. Easy, right? 😊
SELECT store_id, date_trunc(' MONTH ', datekey) como sale_month, sum(price) como Monthly_sales_usd FROM fct_retail_sales WHERE productkey = 'B' GROUP BY store_id, datekey
This can also be done directly within the project itself, taking advantage of the fact table’s capabilities to filter and aggregate the data as needed.
Setting a very granular level of detail for the fact table allows flexibility: we can always aggregate up to simpler levels, such as monthly or weekly summaries. The opposite, however, isn’t possible. For example, if the fact table were built at the monthly level, getting daily detail wouldn’t be feasible. This initial choice is crucial to keeping the model flexible.
6. Deployment
With the facts, measures, grains and relationships defined and agreed upon, it’s finally time to go to the database and create the physical objects.
At this stage, it’s essential to make sure every technical and functional detail documented during the modeling exercise is followed, such as:
- Column lengths;
- Data types;
- Table properties.
This care ensures the model meets expectations and works perfectly in practice. 🎯
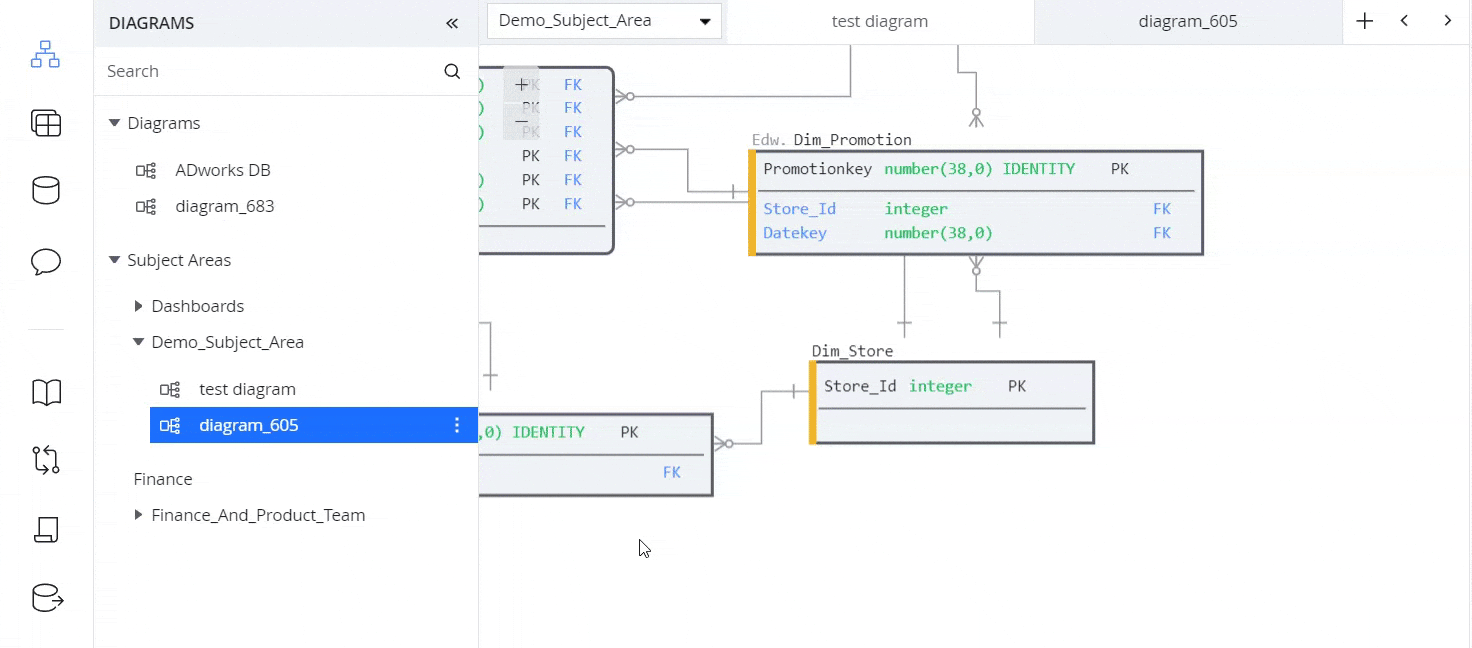
If you’re following along with SqlDBM, you can generate the required DDL directly from the diagram (remember the idea that “the map becomes the territory”?).
If you choose to use Excel, you can also build formulas to generate the SQL from the details you’ve entered.
Whichever tool you choose, the most important thing is to make sure the design is always aligned and in sync with the technical details. This avoids inconsistencies and ensures a functional, efficient model.
Conclusion
After walking through the steps of the dimensional modeling process, it’s clear that it’s an iterative, collaborative effort, where changes in requirements and design decisions are practically inevitable.
To keep the project flowing smoothly, it’s essential to use tools and methods that handle those changes well, keeping everyone involved aligned and in sync.
Once the instruments and processes are defined, modeling becomes a repeatable, pattern-based exercise. So choose your tools wisely, model and keep iterating.
Thank you for following this article to the end! I hope it helped clarify the dimensional modeling process and how to apply it in practice. If you enjoyed the content, I invite you to explore other articles and materials I share about the world of data and analytics. Feel free to leave your comments, questions or suggestions: your participation is always very welcome! 😊